- Details
- Written by Don Wixom Don Wixom
- Category: Uncategorised Uncategorised
- Published: 04 January 2018 04 January 2018
- Hits: 7772 7772
With 2017 at an end, here is a look at the few years and how the market continues to grow at a steady and healthy rate.
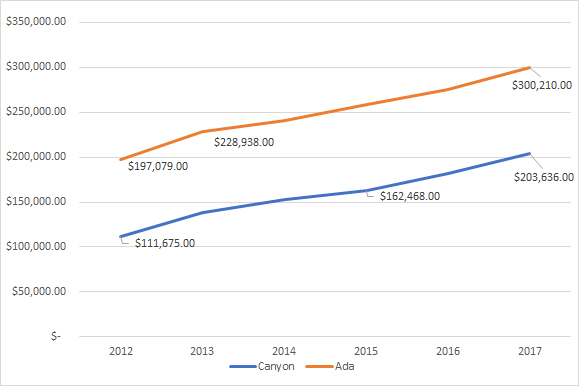
Averages Sales Price
This graph shows the steady growth of the sales price since 2012.
Canyon County is averaging a growth of just over 9% a year while Ada County sits just below 11% at 10.94% a year.
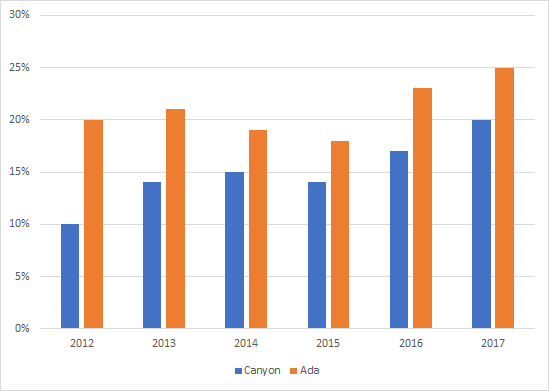
New Construction % of Market
This graph shows the percentage of homes sold that were new construction as compared to already existing homes.
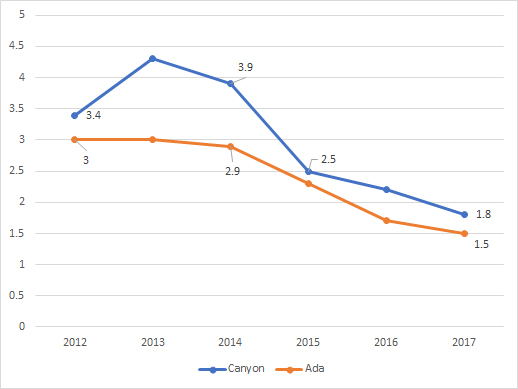
Months of Inventory (Supply)
Months of inventory is defined by how many months it would take to sell every home that is currently on the market if no more homes were to go up for sale. This directly correlates to the sales price through supply and demand. The less inventory there is available, the more it will sell for.